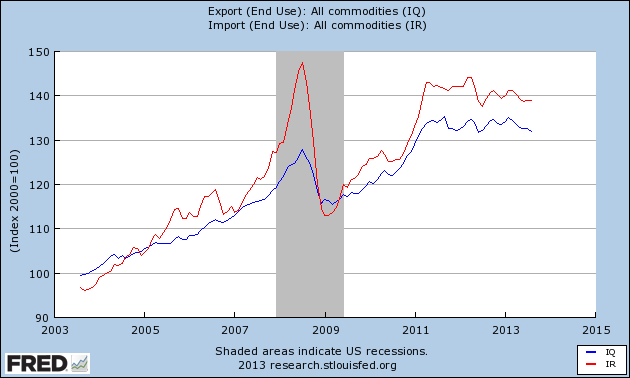
The Export Price Index edged down 0.5% in August according to the September 2013 Bureau of Labor Statistics report. Excluding Agricultural Products, the Export Price Index was only down 0.1%, this contributes to a 0.6% drop over the last 12 months for non-agricultural products.
All Exports: Prices for U.S. exports continued to trend down in August, decreasing 0.5 percent. The index for overall export prices has not recorded a monthly advance since a 0.7 percent increase in February. Lower prices for both agricultural and nonagricultural exports contributed to the August decline. Overall export prices fell 1.1 percent for the year ended in August, the largest 12-month drop since the index decreased 1.3 percent between July 2011 and July 2012.
The Bureau of Labor Statistics tracks this data by Harmonized Tariff Schedule, your HTS code. Below are a few of the HTS codes, if you don’t see your industry below – please let me know and I will post the data for your industry as well.
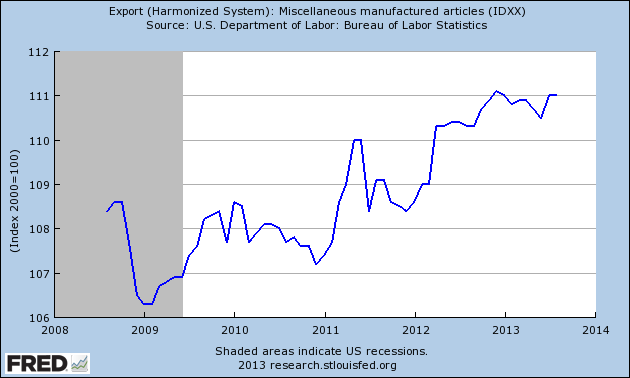
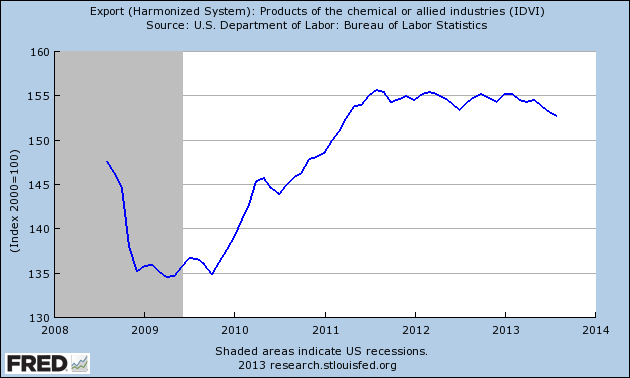
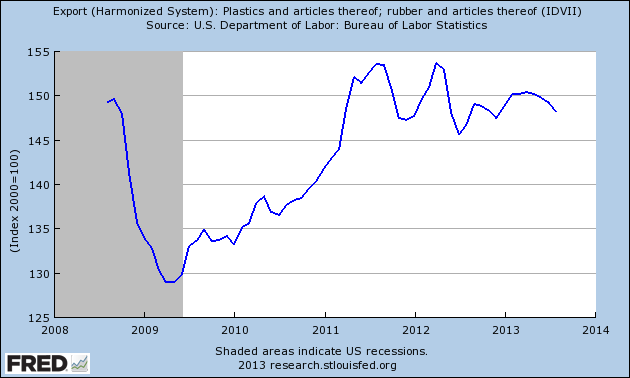
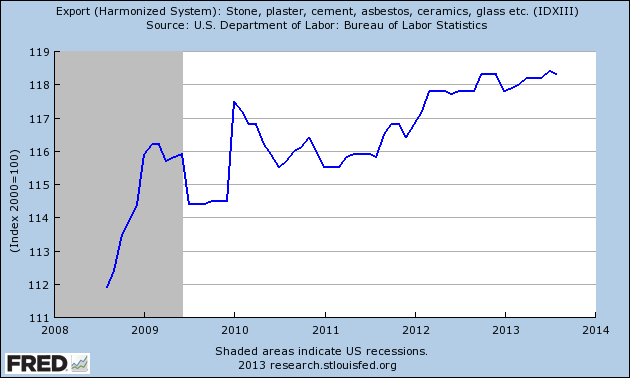
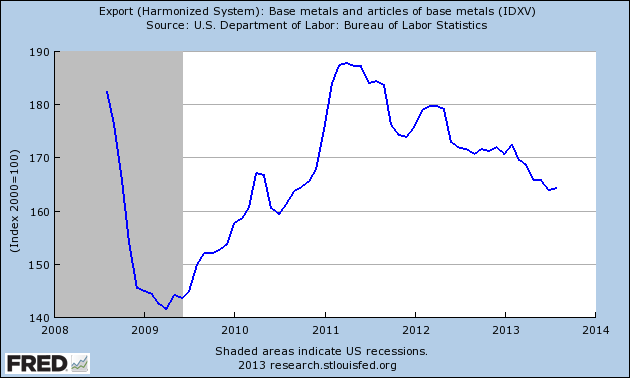
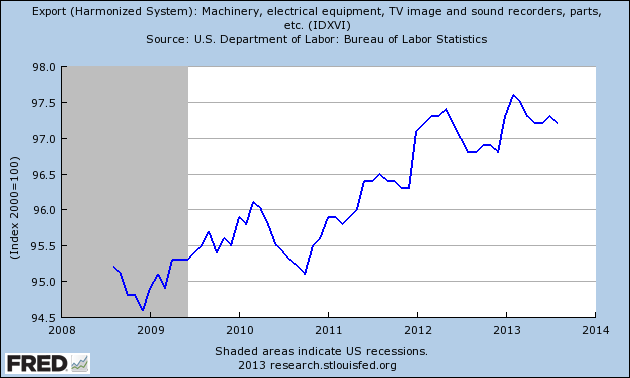
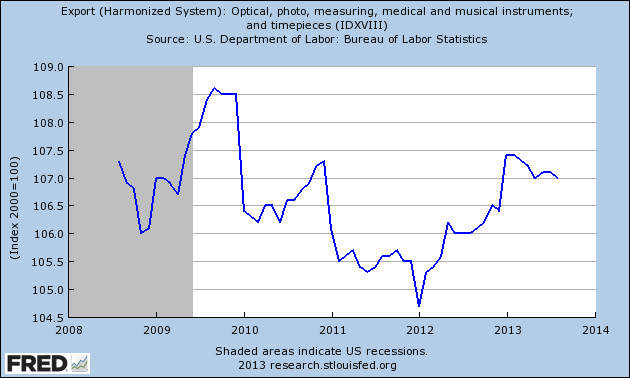
Section VI: Products of the Chemical or Allied Industries -0.3 Decline Section VII: Plastics and Articles thereof -0.6 Decrease Section XIII: Articles of Stone, Plaster, Cement… ..Glass and Glassware –0.1 Decrease Section XV: Base Metals and Articles of Base Metal 0.3 Increase Section XVI: Machinery and Mechanical… …and accessories of such articles. -0.1 Decrease Section XVIII: Optical, Photographic… …parts and accessories thereof. -0.1 Decrease Section XX: Miscellaneous Manufactured Articles. 0 Unchanged (see below for more details by Harmonized Tariff System)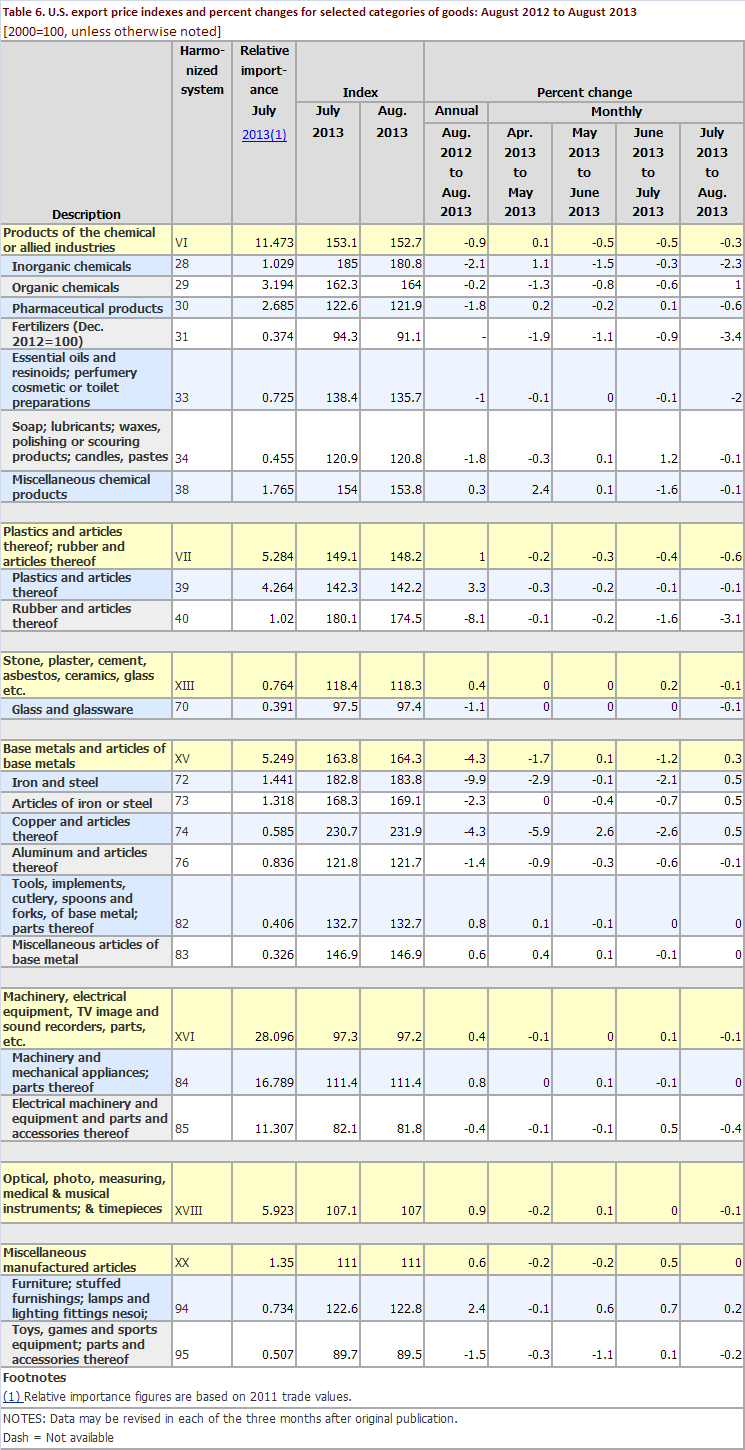 (Click Here to See More Harmonized codes from from BLS)
Leave a Reply