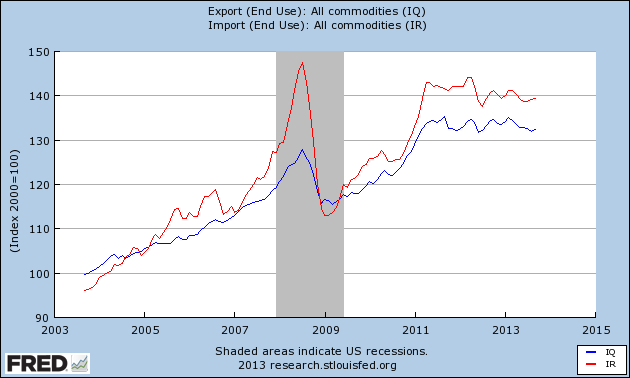
The Export Price Index gained 0.3% in September according to the October 2013 Bureau of Labor Statistics report. Excluding Agricultural Products, the Export Price Index advanced 0.3%. Year over Year from September 2012 to September 2013 the Export Index is still down 0.9%.
All Exports: Export prices advanced 0.3 percent in September, the largest monthly rise since a 0.7 percent increase in February. Higher nonagricultural and agricultural prices each contributed to the September increase. Between September 2012 and September 2013, however, export prices fell 1.6 percent, the largest year-over-year decline since the index fell 2.1 percent between June 2011 and June 2012.
The Bureau of Labor Statistics tracks this data by Harmonized Tariff Schedule, your HTS code. Below are a few of the HTS codes, if you don’t see your industry below – please let me know and I will post the data for your industry as well.
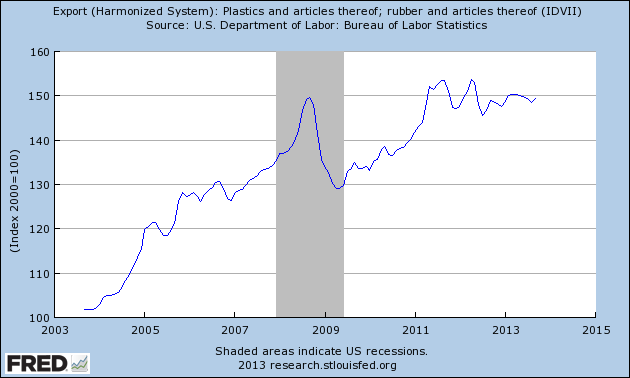
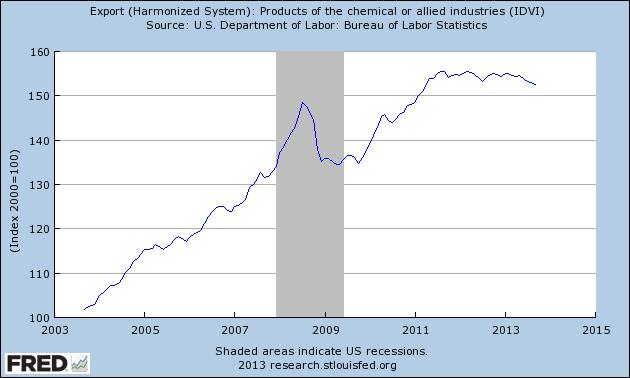
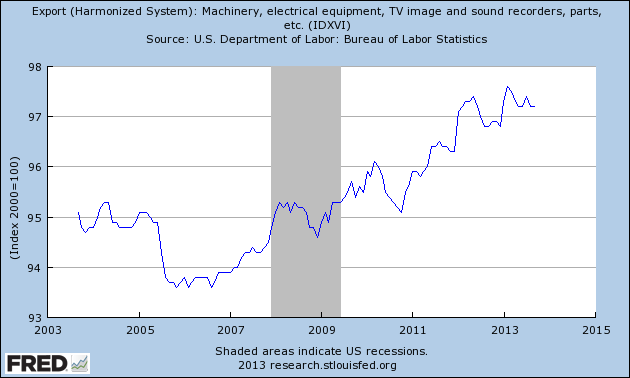
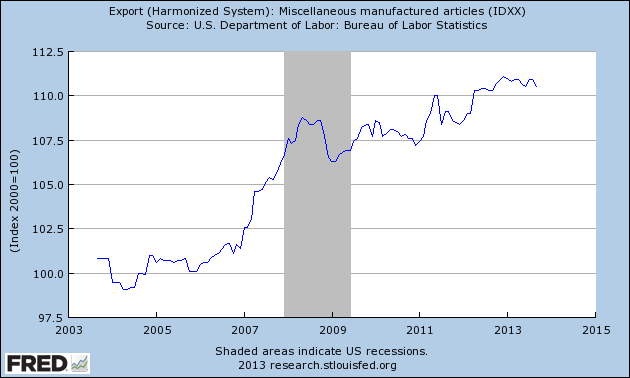
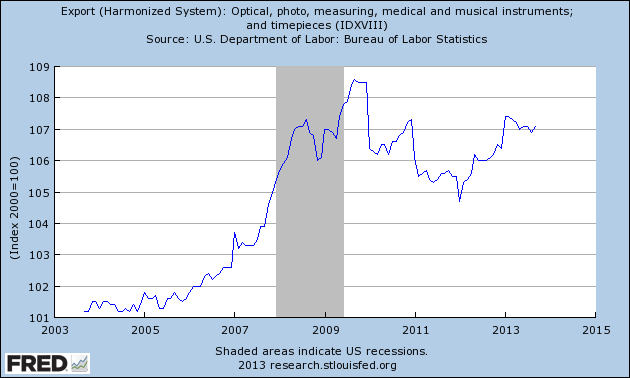
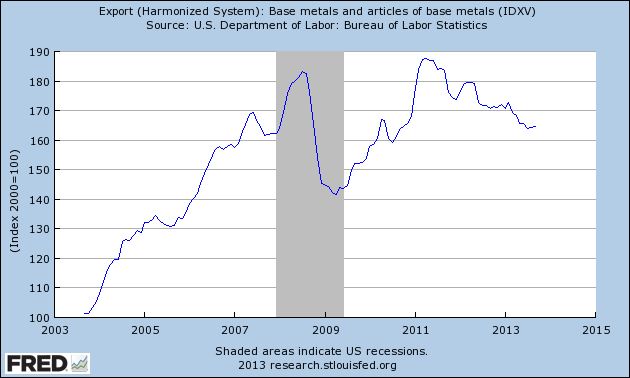
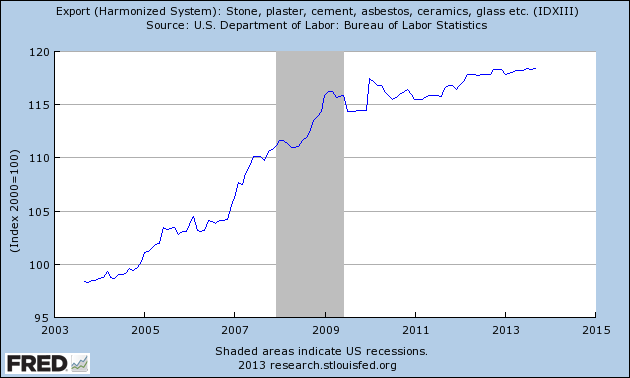
Section VI: Products of the Chemical or Allied Industries -0.3 Decline Section VII: Plastics and Articles thereof 0.5 Increase Section XIII: Articles of Stone, Plaster, Cement… ..Glass and Glassware 0.1 Increase Section XV: Base Metals and Articles of Base Metal 0.1 Increase Section XVI: Machinery and Mechanical… …and accessories of such articles. -0.0 No Change Section XVIII: Optical, Photographic… …parts and accessories thereof. 0.2 Increase Section XX: Miscellaneous Manufactured Articles. –0.4 Decline (see below for more details by Harmonized Tariff System)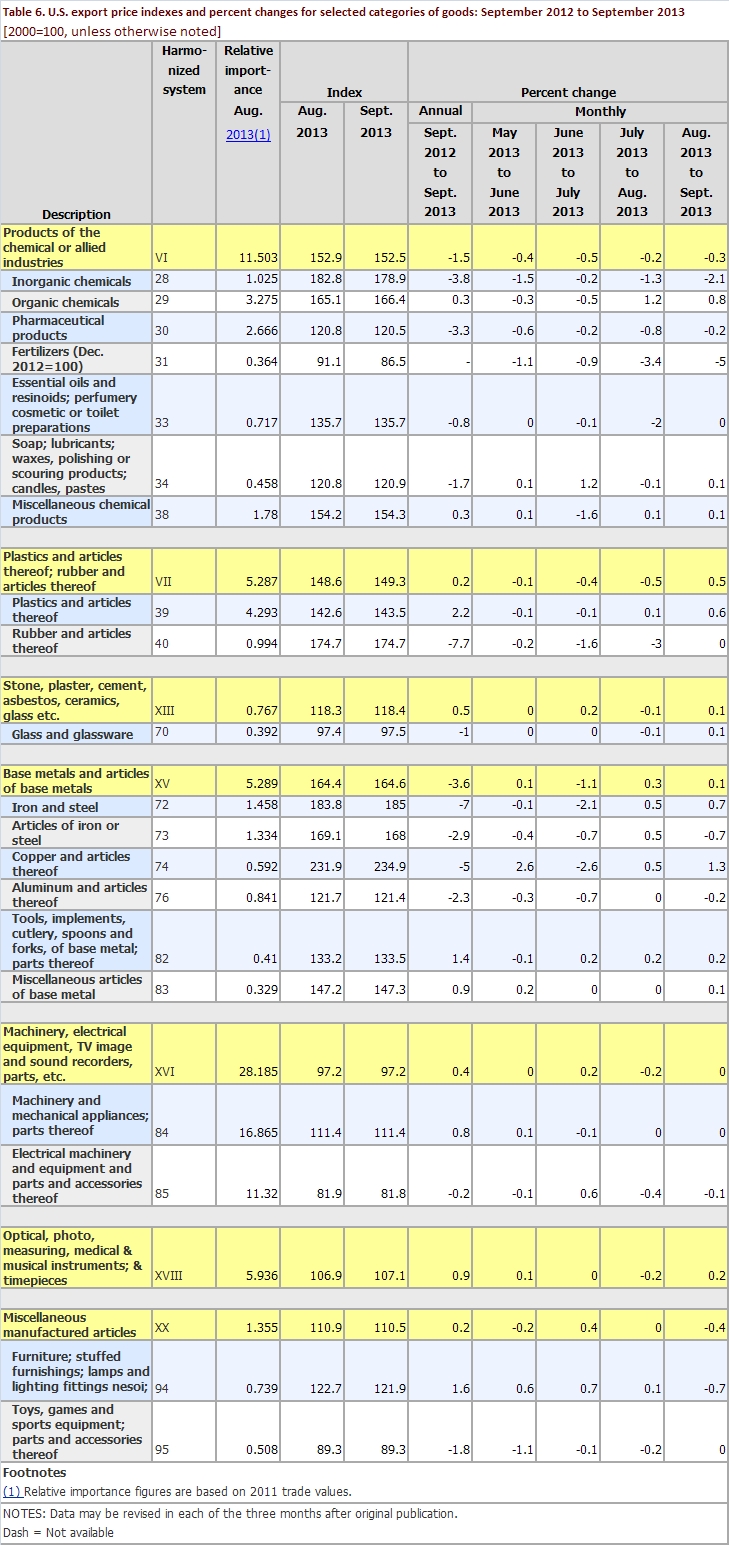 (Click Here to See More Harmonized codes from from BLS)
Related articles


Leave a Reply